What’s the best thing to do with a spreadsheet full of numbers? No, we’re not going to trash it today – we’re going to supercharge it. You can use visuals to turn those boring shapes into living, breathing charts, maps, and graphics. The best JavaScript data visualization libraries let you generate user-friendly resources from your data.
In this post, we will look at some of the best JavaScript data visualization libraries that you can find in 2023. But first, let’s find out What can this type of library do for your data.
What is a JavaScript data visualization library (and what does it help you with)
In short, a JavaScript data visualization library lets you create interactive and dynamic visual representations of data using HTML, CSS, and JavaScript. These libraries give you functions, components, and templates—all pre-built—that you’ll use to create a wide range of charts, graphs, maps, and other visualizations.
Results let you display complex data in an easy-to-understand way that also provides visual appeal. This way, you can easily communicate the insights and patterns in the data fed to your charts.
Even better, you can customize the look and feel of the charts and graphs you create. Often there will be a choice of chart types as well as interactive functionality, such as tooltips.
Overall, the best JavaScript data visualization libraries provide powerful tools to explore and communicate data in a dynamic and interactive way. Insights will let you discover new perspectives on your data, make quicker decisions, and better communicate findings to the people who matter.
Ten Best JavaScript Data Visualization Libraries in 2023
For the rest of this article, we’ll look at a list of the best JavaScript data visualization libraries you can find.
Of course, each library has its own strengths and weaknesses. You can also use each one in different contexts depending on the type of data you want to visualize. It’s a good idea to keep this in mind as we look through the list. The libraries we’ve featured are in no order, and we suspect you’ll have more than a singular favorite by the end of the post.
1. D3. js
First, we have the Data-Driven Document (D3) library. D3.js is powerful and sees a lot of use with developers looking to build complex and interactive data visualizations. You can build using HTML, CSS, SVG, and more.
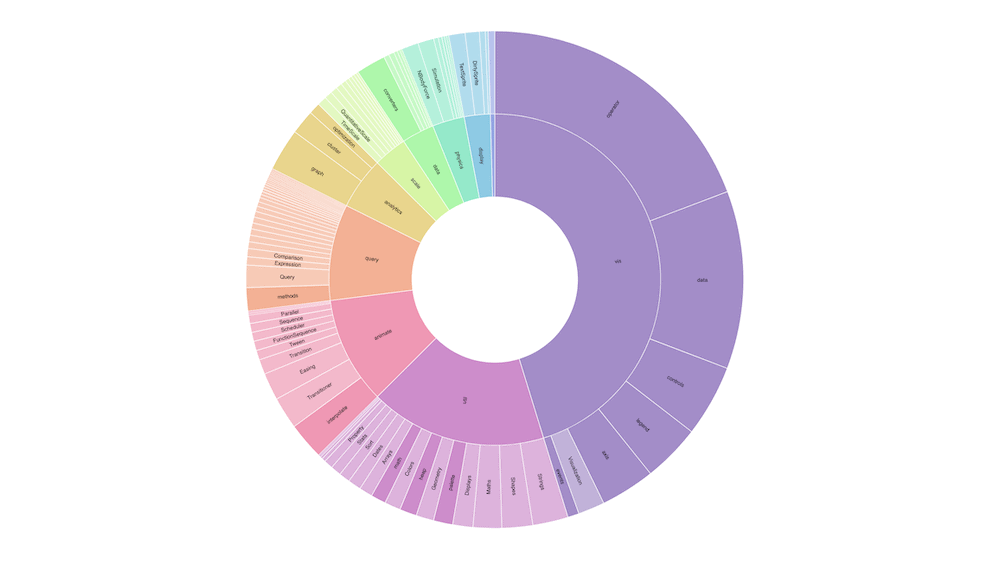
D3.js provides a lot of functionality under the hood. This includes data manipulation, layout generation, and general data visualization. You can switch to D3.js to create custom visualizations that require advanced data manipulation or visual effects. However, the library has a steep learning curve for some, so it may not be ideal for a first time user.
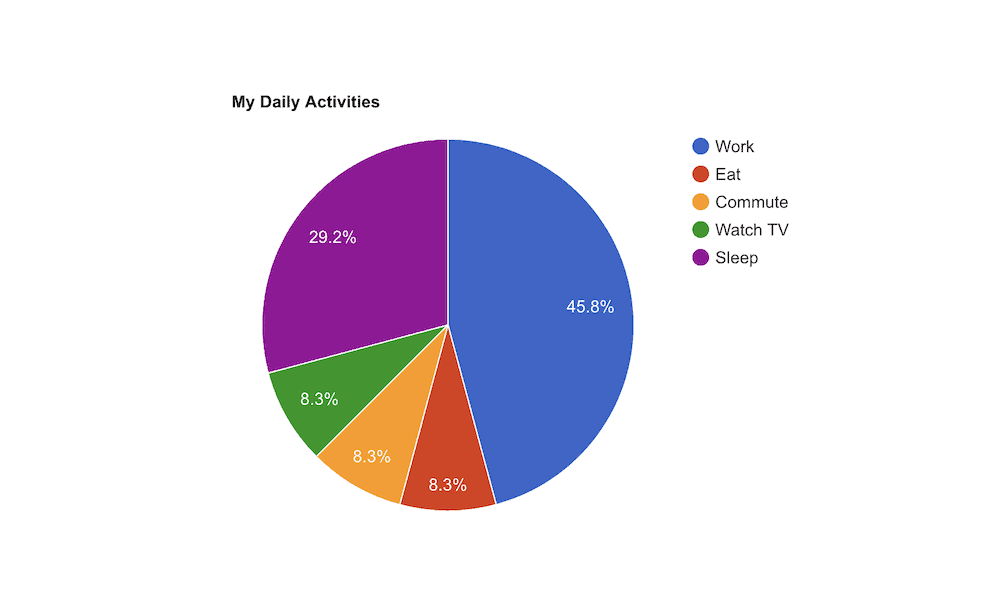
2. Chart.js
Next on our list of best JavaScript visualization libraries is Chart.js. It’s a simple and easy-to-use solution that gives you the tools to create responsive and customizable charts and graphs using HTML5.
True to its name, Chart.JS provides a variety of chart types, including line, bar, pie, donut, and radar charts. The library is solid if you need to create simple visualizations with a limited amount of data.
We also liked the intuitive application programming interface (API) and excellent documentation. Thus, we recommend Chart.JS for both beginners and developers who need to build simple visualizations fast.
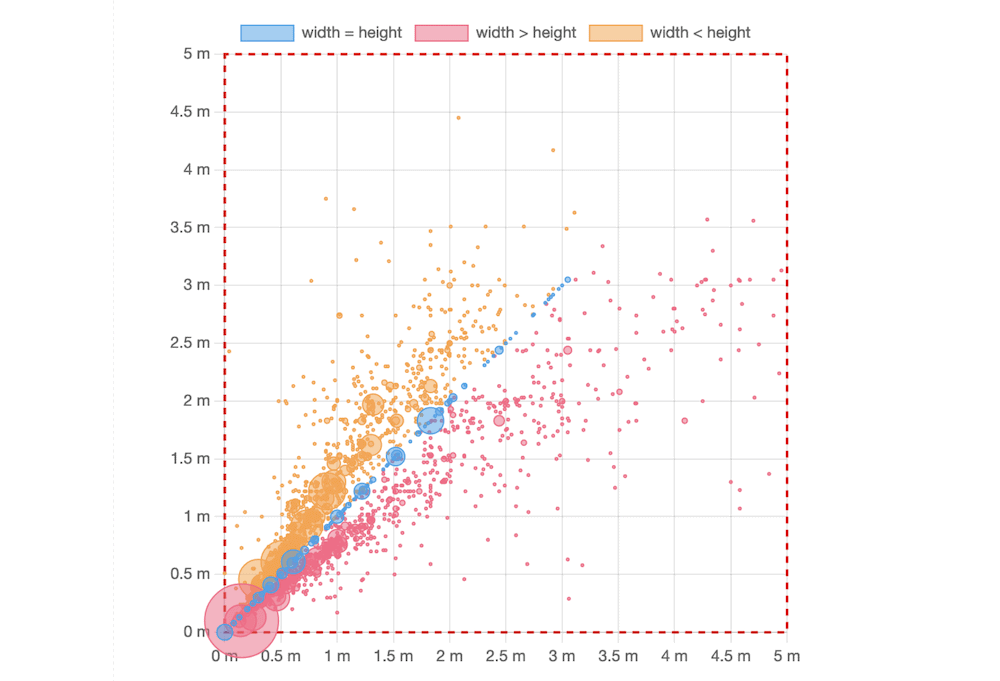
3. Plotly.js
If you’re after a modern and flexible JavaScript library, Plotly.js might be ideal. It lets you create interactive charts, plots, and maps using a variety of chart types. This includes scatter plots, line charts, and bubble charts.
Plotly.js also provides a powerful API for you to build custom visualizations with native functionality like hover text, zooming, and panning. If your visualization requires a high level of interactivity, Plotly.js can help you achieve it. It is also ideal if you need to integrate its functionality with other web applications as well.
4. Highcharts
Highcharts is a versatile and feature-rich JavaScript data visualization library that provides you with a range of customizable chart types. This is another solution if you want to create complex visualizations and implement a plethora of customization options.
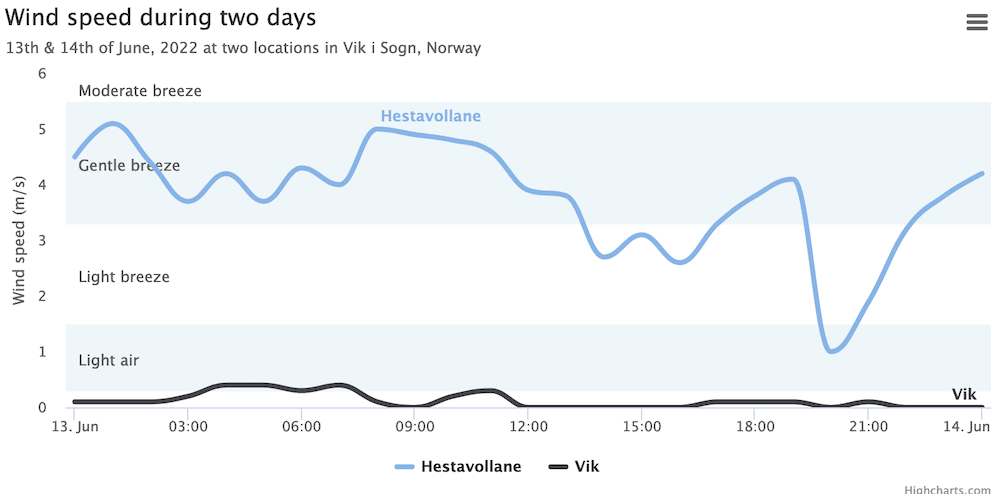
Like other libraries, you’ll gain the ability to zoom and pan, and drill-down is also implemented. Although Highcharts is a premium library, its license starts from $160 per year, Nevertheless, it offers excellent documentation, quality support, and a large user community.
5. Google charts
No list of the best JavaScript data visualization libraries would be complete without Google Charts. It’s free and easy to use because of its cookie-cutter interface.
It is best when you use Google Charts to create simple visualizations fast, as it has both rich simple API and intuitive documentation. As you’d expect, you also get excellent integration with other Google products like Google Sheets and Google Analytics. It will give you ways to create an engaging presentation as well as deep and comprehensive insights.
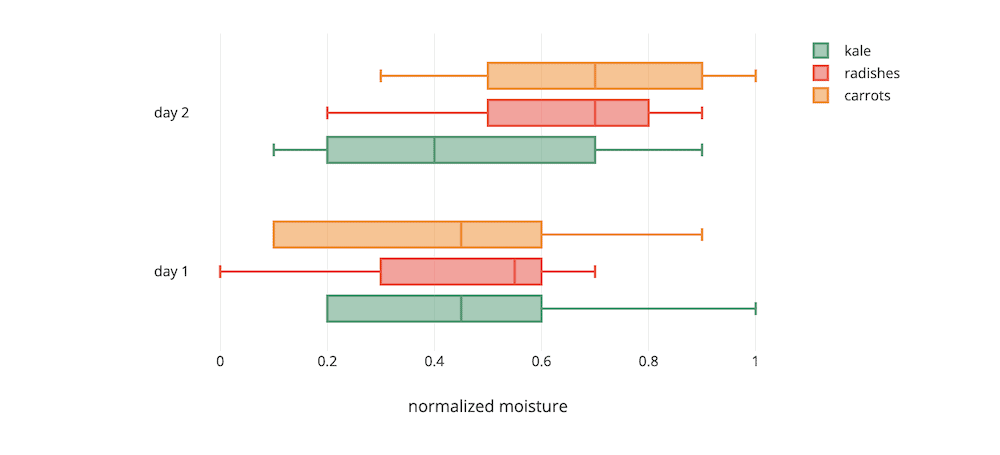
6. Vega-lite
For the most complex of best JavaScript visualization libraries, Vega-Lite would be near the top. It’s super-powerful and gives you the tools to create rich and interactive visualizations using concise and expressive syntax.
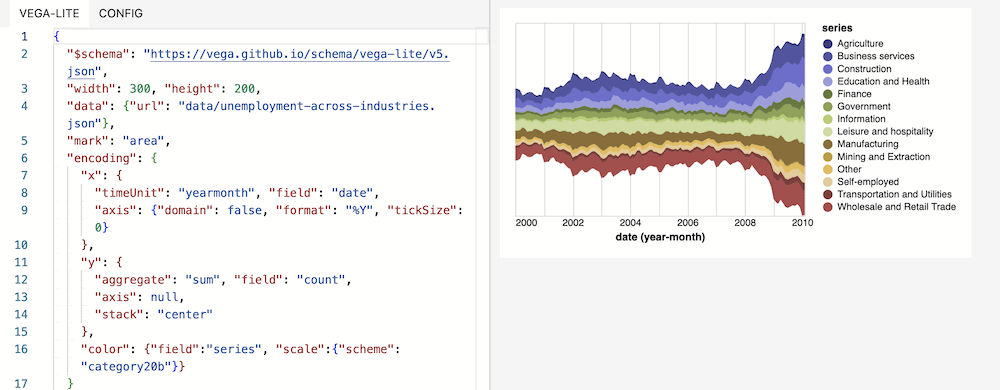
Vega-Lite supports visual transformations (such as stacking) as well as data transformations, such as filtering, sorting, and aggregation. We also like how you can use Vega-Lite in conjunction with D3.js, which gives you a way to leverage the power of both libraries.
7. amCharts
Next, amCharts is a comprehensive JavaScript visualization library that lets you create charts and graphs such as heatmaps, treemaps, and Gantt charts, In fact, there’s so much more you can do with amCharts that we don’t have space to cover.
We also like the efficiency of amCharts, as it’s smaller and processes data faster. However, this is another premium tool with a somewhat complicated licensing model. Prices start at $180 Get up faster.
8. Chartist.js
Chartist.js is a lightweight and responsive library that lets you create simple and clean charts and graphs. It’s one of the best JavaScript data visualization libraries out there for a number of reasons, but we like its minimal yet bold default graphical approach.
The library provides a variety of charts, and is great if you need to create simple visualizations that work well on mobile devices. Overall, Chartist.js is a great tool for creating lightweight and responsive visualizations thanks to its small size and excellent performance.
9. Fusioncharts
Our last library is FusionCharts. It is a comprehensive JavaScript library that provides gorgeous line, bar and area charts among others.
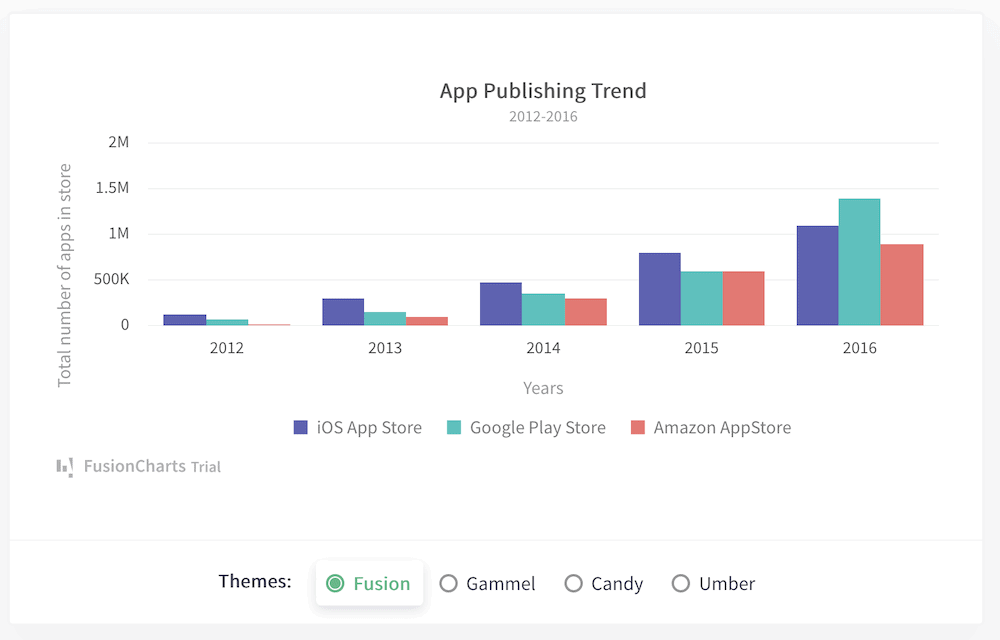
In fact, you get hundreds of interactive chart types and maps. With each you can represent theoretical millions of points of data. As such, it’s stellar for “Big Data” applications and dashboards.
However, to net this powerful functionality, you’ll need to pay. starts with fusioncharts $439 per yearAnd regardless of quality, it can be cost prohibitive.
10. Apache echarts
The last entry on our list of best JavaScript data visualization libraries is Apache ECharts. It is powerful and flexible with lots of available chart and map types.
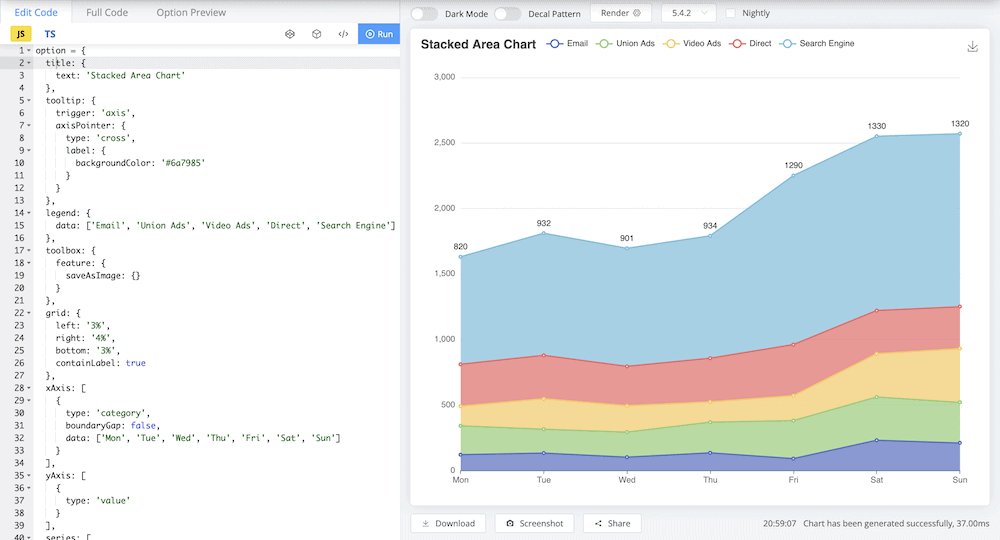
One of its standout features is the powerful API. This lets you create custom visualizations based on your data sets, and includes animation and interactivity to boot. We also think the elegant visual design is one of the best on the market, especially for an open-source solution.
With its excellent documentation and active community, we think ECharts is a great tool for data visualization experts and developers. This is an option for many situations, especially where you need to include accessible visualizations.
How to use the JavaScript Data Visualization Library with WordPress
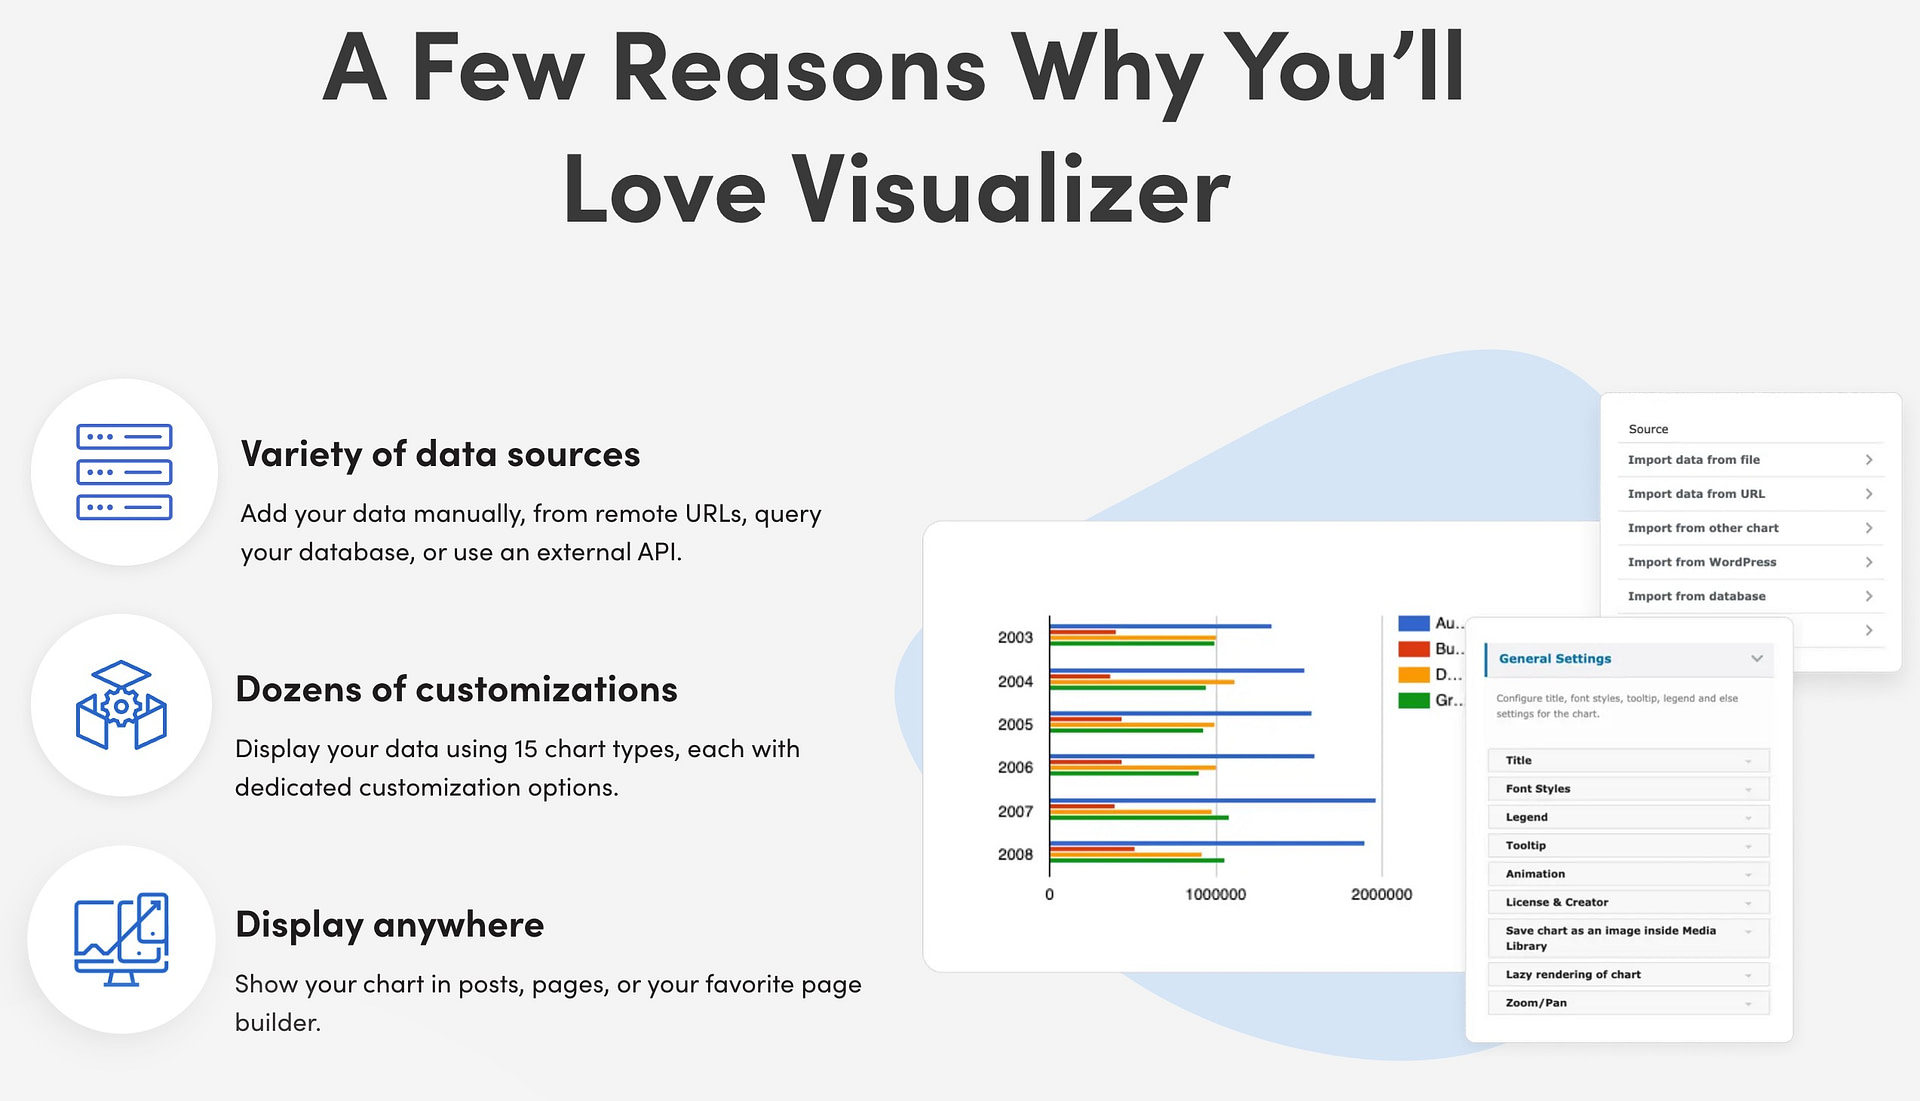
If you want to showcase data visualization resources on your WordPress website, the Visualizer plugin gives you an easy way to work with many of the best JavaScript data visualization libraries out there.
Instead of needing to use your own code, you can add your data to the Visualizer and let it do the work for you.
With the Visualizer plugin, you can create 15+ interactive chart types using your choice of different data visualization libraries, including Chart.js, GoogleCharts, and DataTable.
To supply the data for your charts, you can use a variety of sources, including CSV (Upload one or sync with a hosted CSV file), databases, external APIs, and more.
Try the best JavaScript data visualization libraries
Facts don’t lie, but those who matter can ignore them if those facts don’t stand out. Appearances count, and the data you get from your analytics should look the best. This is because visual data can educate and convince those in power that they need to take action to do what is best for the business.
The best JavaScript data visualization libraries let you do just that with a minimum of fuss. However, you will be turning to many different libraries to achieve your goals. For example, chartist.js Ideal for sharing graphs on mobile devices. opposite of this, fusioncharts Can handle millions of data points and present them in a snap. All of the solutions on this list will come in handy at different times.
If you want to display visualizations in WordPress, you can use the Visualizer plugin to get access to an easier way to work with some of these data visualization libraries.